Auckland property, with the working shown.
A property model for 17 North Shore and Eastern Bays suburbs. Every range carries its source, its error and its date.
The current snapshot
Model output from the current static snapshot, not asking prices. Counts and medians use the standard property set. Method and error are below.
Built like a research project.
ByteMind is a small analytics practice. Property decisions are often made with a number nobody can inspect: no inputs, no error, no date.
We built this engine to be inspectable. Public listing data and council valuations go in. The method is one we use in research: compare like with like, hold data back, measure the error, and write down the limits. Every range names the signal it came from.
We also show where it is weak. Text analysis helped when the council valuation was missing, but no topic survived correction, so it is not used in the valuation. That is how a reader can tell a strong signal from a weak one.
From a listing page to a value range.
Each range chooses the best available signal, labels it, and says what it cannot support.
-
01 Recover the price signal
Asking price, guide, deadline or auction date, read from the listing page and dated.
-
02 Value the tenure
Leasehold, cross-lease and unit title are valued differently before any number is produced.
-
03 Compare nearby sales
Sold prices weighted by distance and recency, normalised by council capital value where one is available.
-
04 Calibrate a fallback
A hedonic model for listings without an AVM or usable comparables, with an 80% interval and its error published.
See the market-level evidence.
The embedded view is aggregate-only: map, filters, market view and research lab. No listing cards, no CSV.
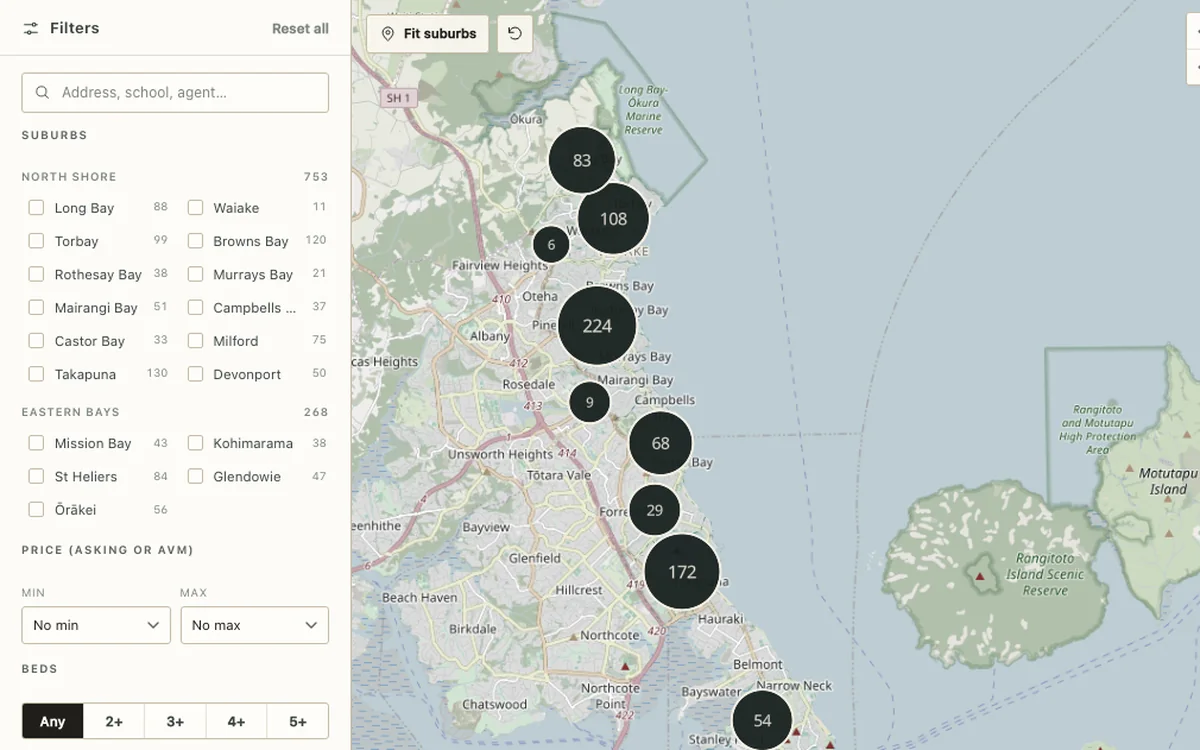
Aggregate mode shows market-level indicators only. The full listing-level research interface is published separately on the independent research site.
The aggregate app could not be embedded here. The screenshot above and the links below still work; you can also open the market view directly.
Explore: market view · research lab · full listing-level interface ↗.
What we do with it.
Scoped to the decision in front of you. Fees are agreed before work begins.
Suburb scan
A one-page brief per suburb: median range, value-to-CV ratio, days on market, AVM coverage and sale-method mix.
Discuss a suburb scan →Due-diligence pack
The sources, range and stated error behind one property, plus the questions to put to the agent, valuer and lawyer.
Discuss a due-diligence pack →Ongoing or commissioned
A monthly mark-to-market across holdings, or a commissioned analysis with a documented method you can publish or rely on.
Discuss an engagement →What this is — and what it is not
- Aggregate view only, on this site. This page does not re-publish listing-level content; the listing-level interface is hosted on the independent research site.
- Decision support, not a valuation. Not a valuation under professional standards, not a substitute for a registered valuation, and not financial, legal or tax advice.
- A snapshot, not a live feed. Figures refresh daily. Verify the title, any ground rent and consented works before making an offer.
Related research: long-run property market trends in New Zealand and Australia · what a range-first model can and cannot claim.